
by Sandy Ludington
July 7, 2026
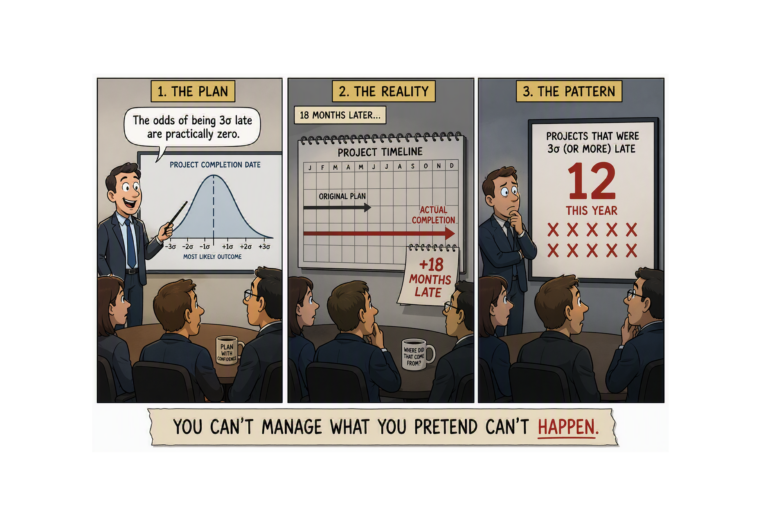
Realistic single point estimates for schedule and cost are essentially impossible. We often miss key disrupters entirely and underpredict the impact even for risks we anticipate. Analogous empirical data is the best way to inform ourselves – if 100 people did this thing before, how did they fare? But when you go beyond directly relevant historical experience, using statistical methods becomes essential in estimating outcomes. It quantifies risk and sets more appropriate expectations for you, your investors, and the marketplace.
And for many people, the first probability distribution that comes to mind for performing these kinds of analyses is the normal distribution. The normal distribution (or “bell curve” or Gaussian) has been badly abused in many settings though, including statistical estimates for cost and schedule in large projects or complicated development programs. There are plenty of phenomena for which it does well, but in estimating cost and schedule possibilities, the normal distribution does not cut it.
When we model uncertainties in development program cost and schedule or in financial models for a technology’s deployment, we at Novellum Partners generally avoid the normal distribution. It’s not a good representation of true probabilities for those things. Nassim Nicholas Taleb, in his bestsellerThe Black Swan, excoriated the normal distribution for its poor applicability to real-world events and pointed out many examples of undeserved optimism driven by the assumption of a normal distribution. While Taleb provides more detail in his books, the major reasons a normal distribution fails in cost and schedule estimating can be summarized as:
- Negative number impossibility. If the mean of the distribution is a positive number, then the normal distribution will have some probability (though it may be small) of getting negative values. For figures measured in dollars and days, it almost never makes sense to allow negative numbers.
- Unrealistic Symmetry. Most uncertainties are not actually symmetrical. When it comes to costs or durations, there is usually a greater chance of things taking longer or costing more. It’s Murphy’s Law.
- Thin Tails. The normal distribution has probability concentrated in the middle with ever-decreasing probabilities in the tails. Real phenomena sometimes have “fat tails” or probability concentrations at the extremes.
If you model uncertainties using normal distributions, you end up compounding these unfair assumptions in your analyses – and these generally all lead to more optimism in modeled outcomes…optimism you can ill afford.
In modeling uncertainty for cost and schedule, or in assumed parameters for financial analyses, we generally choose from two options instead of the normal distribution.
The Lognormal Distribution
The Lognormal distribution is a probability distribution where the logarithm of the variable follows a normal distribution. It does not produce any probabilities for negative values and is asymmetric, allowing for long tails on the high end. Below is an example random sample from a lognormal distribution:

The lognormal has the advantage of a good amount of probability showing up in the right-hand tail, which qualitatively lines up with our common experience – things take longer and cost more than we anticipate. Schedules never shift left. And even if we anticipate the possibility of delays and cost overruns we know that real-life impacts can often be enormous, and with meaningfully large probability. The lognormal distribution avoids all the major downsides of the normal distribution.
Triangle Distribution
The triangle distribution is created by setting a most likely value (the mode) and widths for maximum and minimum values. It has the advantage of spreading more probability out to higher values without a steep drop-off in probability, which might be valuable if you think some higher values are reasonably likely, but more tightly bounded. Like the lognormal distribution, the triangle distribution is asymmetric and can easily be set to avoid negative values. It won’t lead to very long tails though, unless you set the widths very wide explicitly – the triangle distribution has firm boundaries. A random sample from a triangle distribution is shown below:

Triangle distributions are easy to define at the outset of an analysis and they allow for meaningful representation of uncertainties even without detailed knowledge of real-world distributions. Triangle distributions may not be as realistic as lognormal distributions in most cases, but they could be a better choice when you have less confidence in how to define the distribution mathematically, but more confidence that real possibilities will be in a tighter range. An example would be the real cost of an off-the-shelf component. When there is some variability, but an observable maximum and minimum, the triangle distribution does well.
All Together
It’s also worth mentioning that you rarely know, in detail, what a probability distribution ought to look like. Just as you likely do not have analogous examples of other projects just like your own, you will not have thousands of data points from perfectly analogous real-world situations to inform each of your distributions. The value of statistical modeling is in understanding the breadth of possibilities, the significance of each assumption, and the relationship between them all. You may not have a very good sense for the exact distribution you should use to represent duration for a given phase of your project, but you may be able to determine through your analysis that nailing down that particular duration is very important to the overall schedule, helping you make decisions to invest in improving your predictions, apply more resources to that phase, or take some other action to reduce your risks. Starting with distributions that at least have the right general shape and cover the right range is the best way to set yourself up for success.
At Novellum Partners we help define the assumptions from which insights develop. Our risk management and modeling practice can help you improve your understanding of vulnerabilities, focus your attention on the things that matter most, and make confident decisions as you inevitably encounter difficulties in realizing your complex product and project objectives. Come talk to us and we’ll help you develop the approach that’s best for your goals – without falling into the normal traps.